TT.PFM: Portfolio Management - Flexible & Understandable
The portfolio management module for INIPRO
With our portfolio management module for INIPRO, you can now plan, manage and securely store your different schedule deliveries.
Whether for energy suppliers, energy consultants or energy-intensive companies: The professional portfolio management of timpetools catapults your procurement to the latest technical level. Energy trading has never been so efficient!


Three reasons for TT.PFM
1.
Flexible
2.
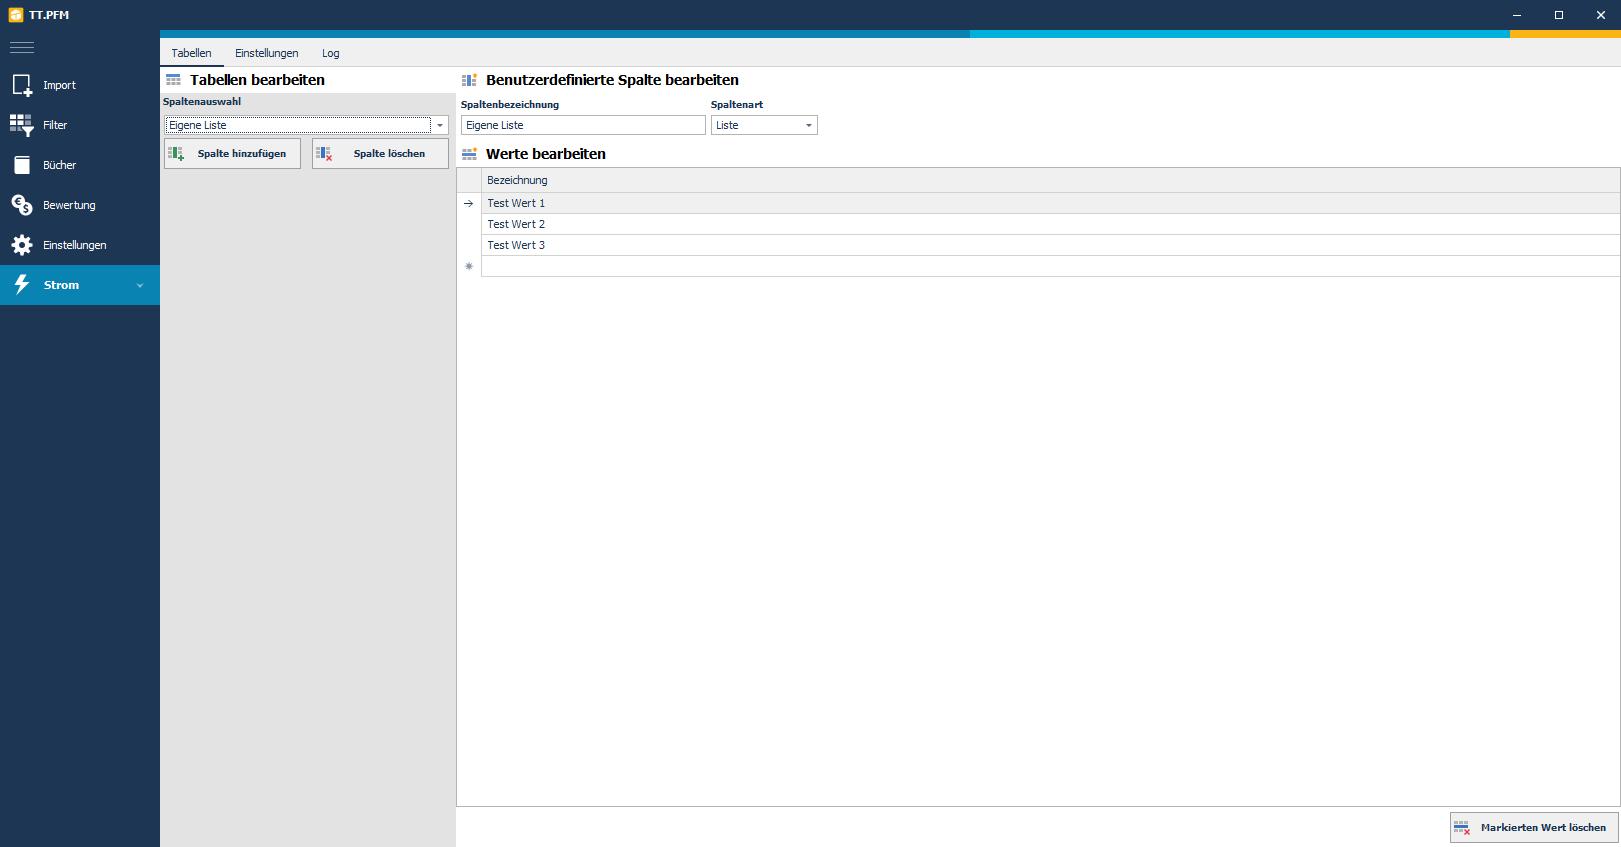
Own variable fields
Are you missing fields in the master data? No problem. You can freely define up to 20 fields and also create lists, dates, numbers or text fields. This means that even unusual master data should find its way into the TT.PFM database without any problems.
3.
Master data
The fields available in the standard for describing an electricity or gas time series or a transaction enable you to categorise all imports in a very differentiated way. Master data for any number of time series can be assigned both directly during import and subsequently.
Explanation of terms
Time series
Filter
Books
Have we aroused your interest in TT.PFM?
What features does TT.PFM offer?
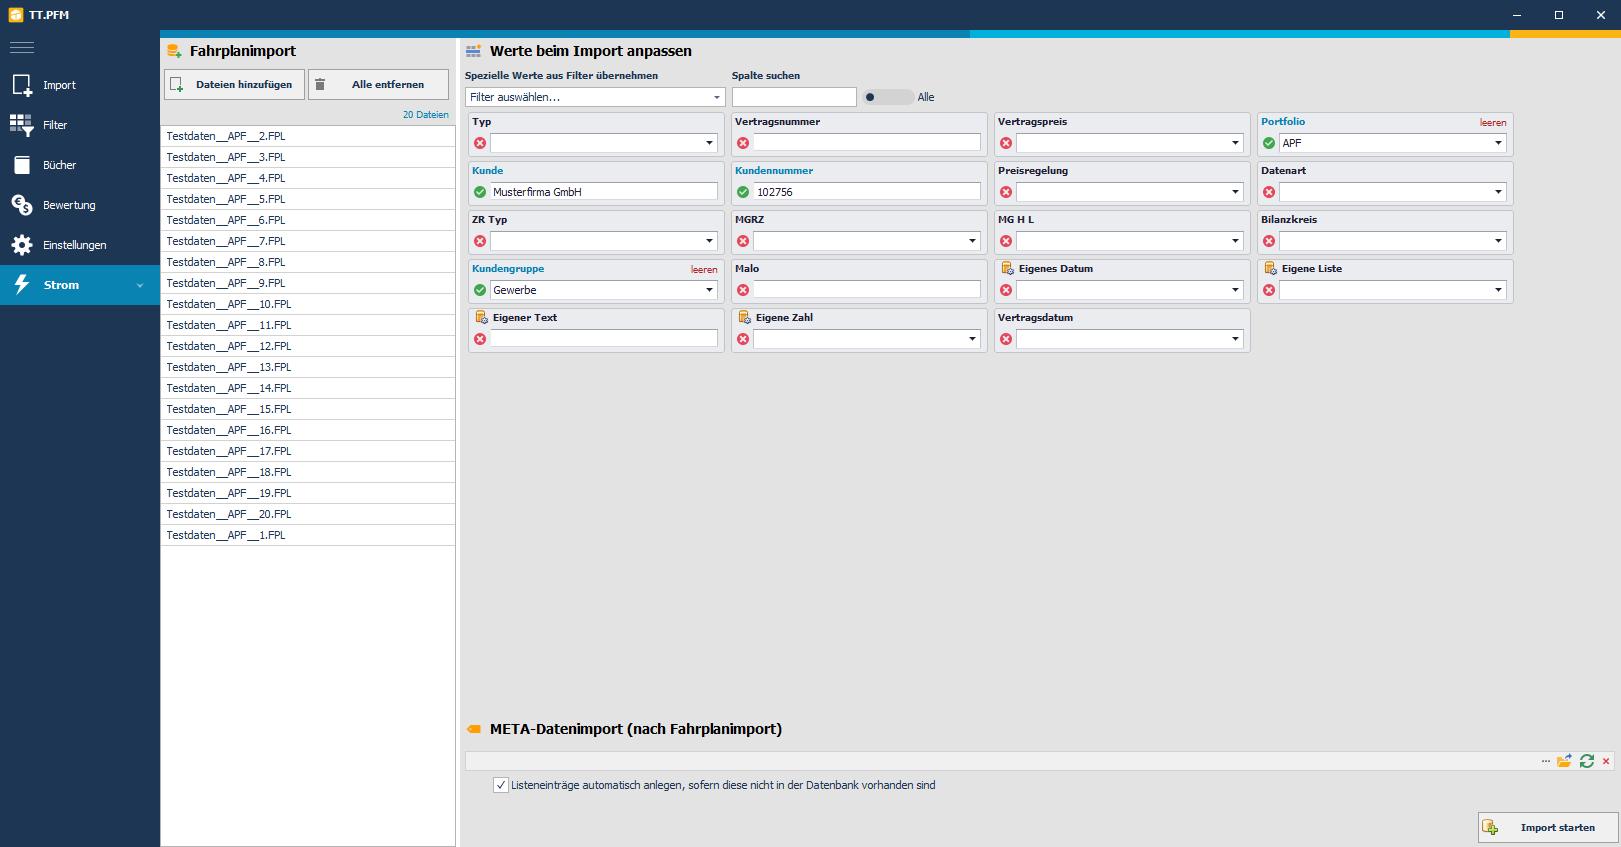
Import/Export
Data exchange with the INIPRO base system is extremely simple. Time series in INIPRO are available as files. You select them and move them with one click to TT.PFM, which opens automatically. Here you determine the master data and start the import. Or you import everything first and later determine which master data you want to assign to the new data. If there is a lot of data, there is an interface file on a CSV basis in which you can specify the imports. Exporting is just as easy. Select the time series or book, right-click and export for INIPRO. Afterwards, you can use all the usual functions in INIPRO for further evaluation and analysis. All valuations from TT.PFM can of course also be exported in Excel format.
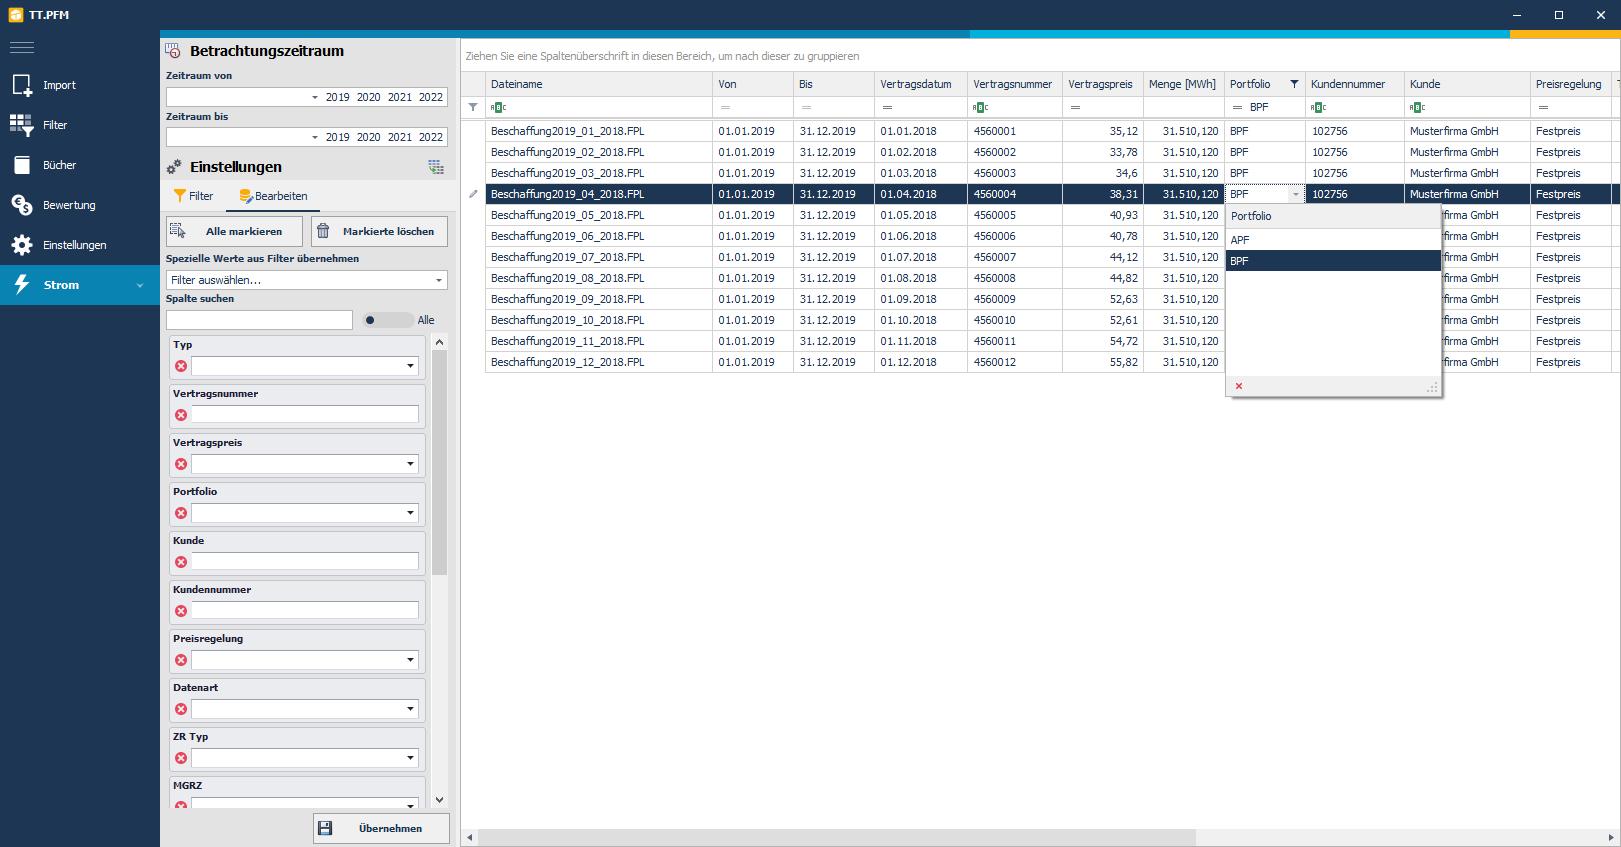
Filter
Books
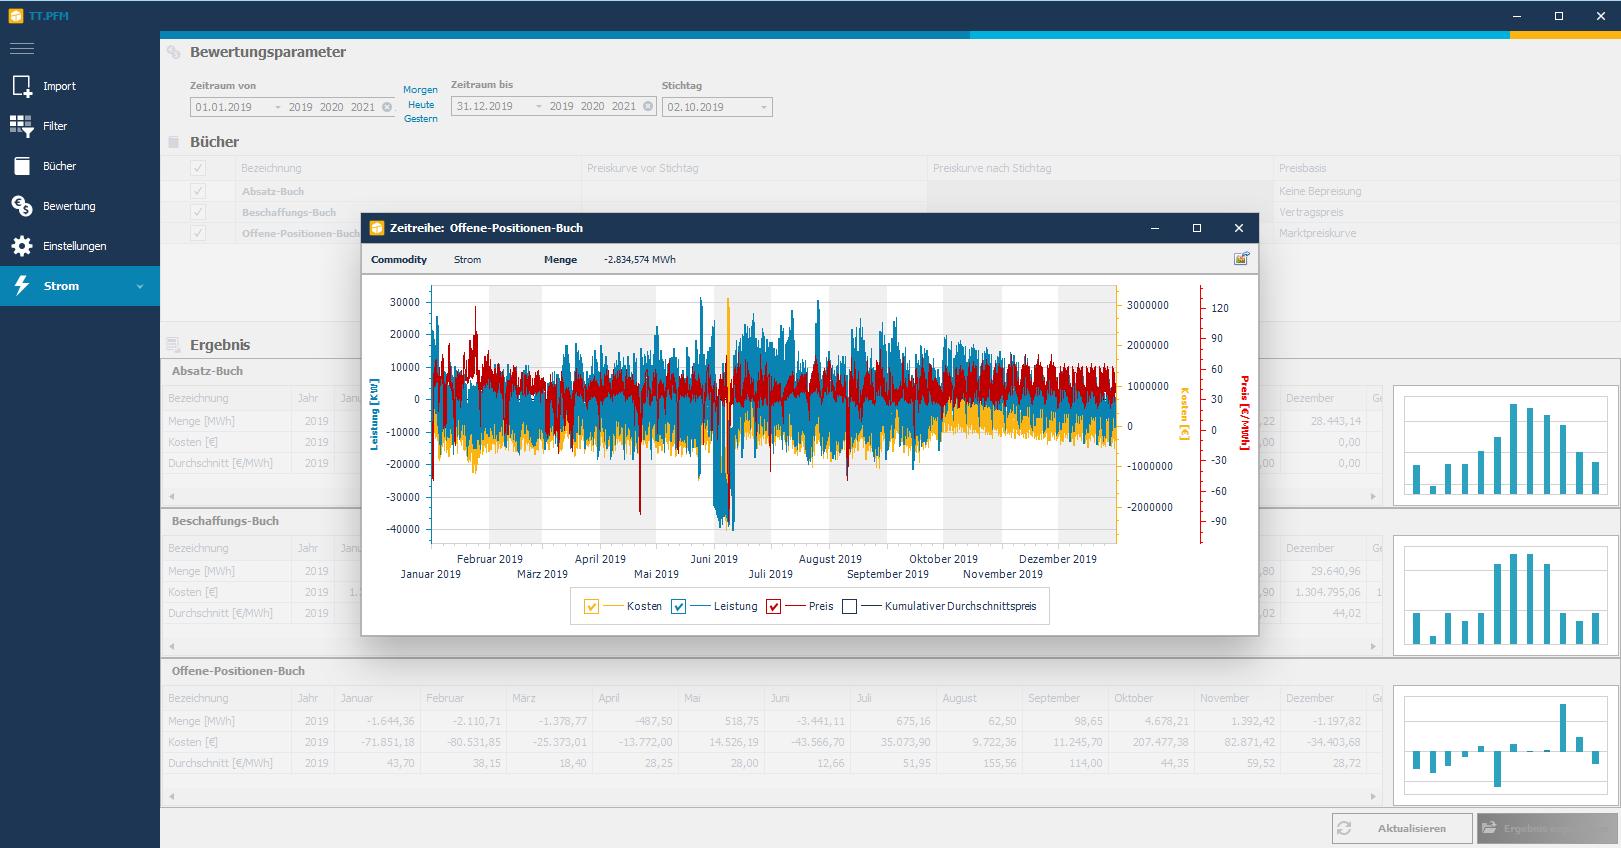
In portfolio management, one works with books. A book consists of at least one filter and thus at least one time series. In the same way, however, the procurement book of a customer can contain the addition of the filters customer1_forward market procurement and customer1_spot market procurement. The book for the open quantities would then be the addition of all procurement filters minus the filters for the sales forecast, e.g. customer1_sales_long-term + customer1_sales_medium-term + customer1_sales_short-term. The book result can be viewed graphically at any time or exported to INIPRO for further analysis.
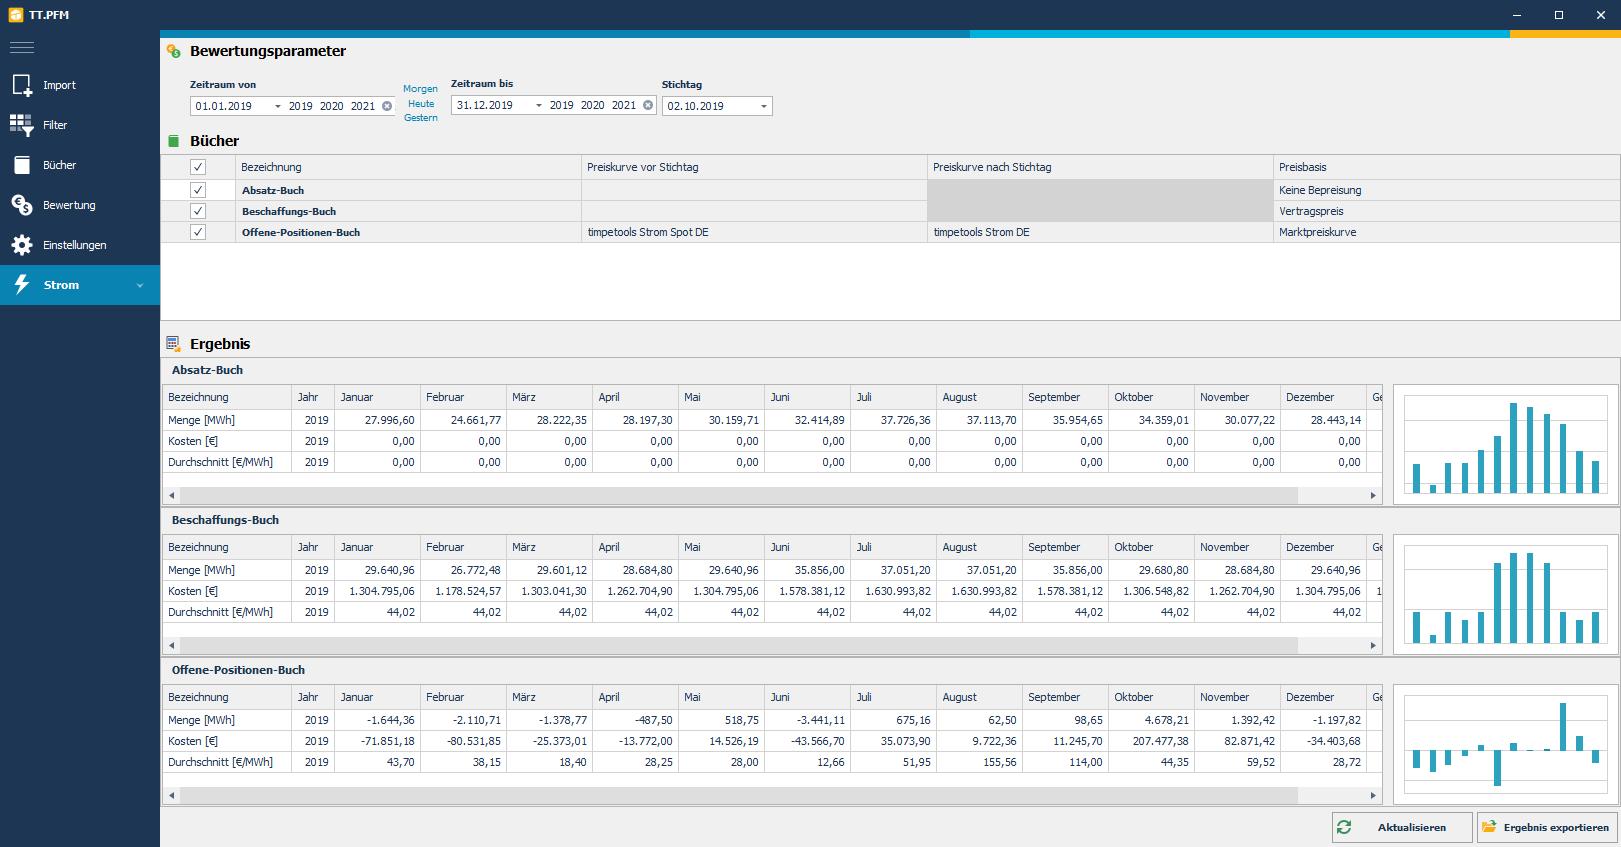
Rating
Further information
These products might also interest you
Energy sales for
Business customers
Sales for individual business customers in the EMDaCS price portal. Automated. Simple. Trustworthy. Secure.
Market price analysis for
business customers.
Transparent market prices for own load profiles with price ticker and price history. Energy procurement simple and secure.
The Swiss Knife for
the Energy Industry
The intuitive and inexpensive way to forecast, analyse, price and decompose electricity and gas schedules.
The intuitive
weather data portal
Use all historical and current weather data of the German Weather Service integrated in INIPRO for your forecast.
Market price curves
for electricity and gas
Keep an overview: with daily updated and intraday market price curves for electricity and gas directly in INIPRO.