
Indicators
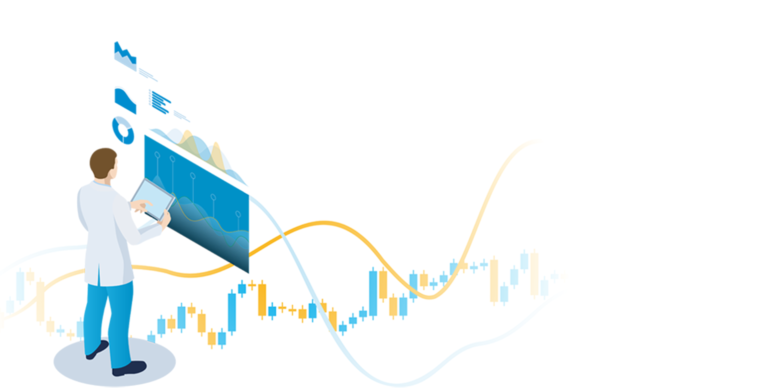
In EMDaCS you can use different price indicators and oscillators. The graphical analysis helps you to find the optimal time to buy.
Play Video
Indicators in EMDaCS
- EMA20
- EMA90
- EMA200
- SMA20
- SMA90
- SMA200
- Bollinger Band
Oscillators in EMDaCS
- Williams
- MACD
- Momentum
Pricing
- Indicators and oscillators help you find the optimal time to buy
Market reports
Technical chart analysis is only one component in determining a good time to buy. Equally important is the assessment of current fundamental events. In this way, trends can be identified in advance and used for one's own procurement strategy. Our cooperation partner enerchase has been successful as a market analyst for many years and provides us with suitable market reports for this purpose.
Information on market reports
- competent market information from experienced analysts
- optionally orderable
- weekly up to date